What is ROAS?
ROAS is a performance parameter that has recently been gaining popularity among the mobile
advertising community. It can directly reflect a digital marketing campaign’s efficiency and
performance. Its metric is: total ad revenue divided by total marketing spend.
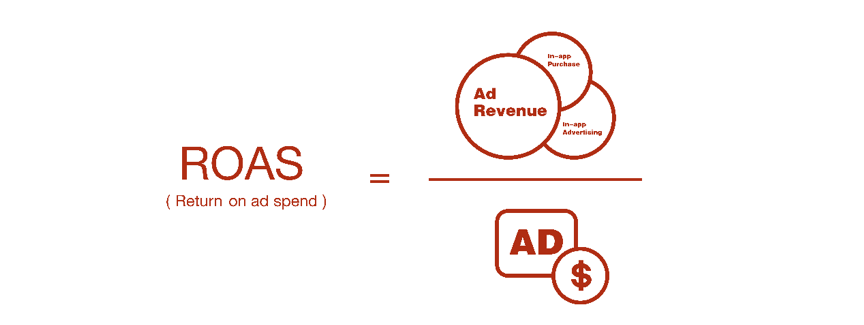
Notably, the total ad revenue refers to the total ad value generated after the ad is displayed,
including in-app advertising (IAA) and in-app purchase (IAP). IAA is generally the revenue that
developers earn from serving in-app ads through Ad Networks.
The mediation product used by developers will record the ad revenue generated through each Ad
Network. IAP and ad spend can be statistically measured through third-party monitoring platforms
such as Appsflyer and Adjust. With these sets of data, developers can have a more comprehensive
understanding of the app’s profitability, and also calculate the ROAS value.
Evaluate ad performance with ROAS
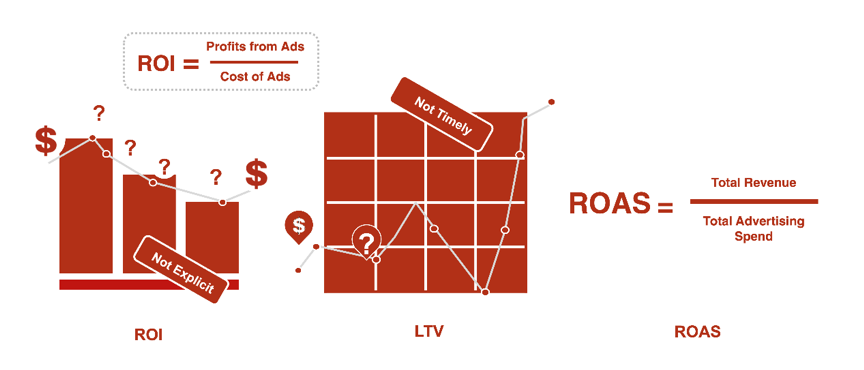
ROAS provides a new measurement for developers to evaluate ad performance. Before ROAS, ROI and LTV
are probably the two most commonly used parameters. However, ROI is the ratio of ad profit to ad
cost, and does not reflect ad effectiveness directly as sometimes other costs are also counted in.
As for LTV, it represents the total value of a new user's entire life cycle since installation. If a
user's LTV is higher than the UA cost, it means the App is profitable. However, given the time
factor, developers are unable to predict user’s subsequent APP-using behavior or market changes.
Therefore, from this perspective, LTV cannot reflect ad performance timely. ROAS addresses both the
directness and timeliness issues.
Evaluate APP potential with ROAS
In addition to campaign performance, ROAS can also be used to evaluate the potential of an App.
Before ROAS, people usually estimate an App’s potential by Retention Rate (Retention Rate) and CPI
(Cost Per Install, i.e. single installation cost). These two parameters were highly valued by
publishers to screen new games. Generally speaking, when a new casual game launches a UA campaign in
the US market, if the CPI is around $0.25 and the 1-day retention is around 40%-45%, the App will be
deemed competitive and worth investing. Such new games are usually favored by publishers.
CPI only shows whether a product or its marketing materials can attract potential users in target
markets to download at a lower cost. And retention rate can reflect how much users like the product.
However, since these two indicators are unable to reveal APP’s ad monetization and non-ad
monetization capability, there is a lack of direct analysis on the APP’s profitability. While
retention rate and CPI are important, other information of the APP should also be considered.
For instance, three casual games are campaigning in the US. As can be seen from the following
figure, the retention rate of Campaign A is 45%, indicating high satisfaction among users and
they’re likely to log in again. The CPI of Campaign B is $0.2, indicating that the game or its
marketing materials are competitive and attractive in the market and are able to acquire new users
at a lower cost. In comparison, Campaign C is mediocre in terms of both retention rate and CPI.
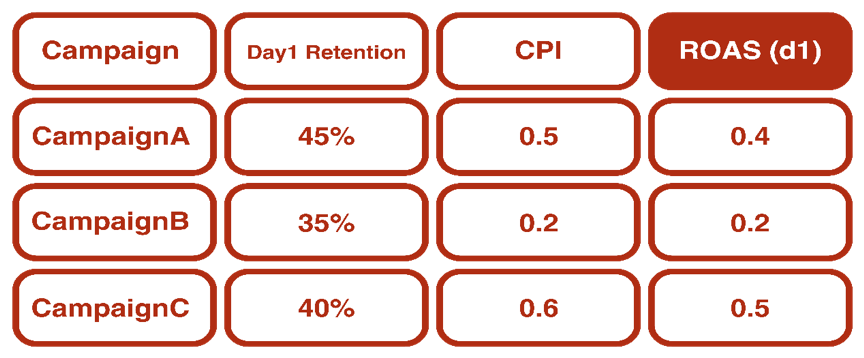
However, the ROAS of Campaign C is the highest at 0.5, which means that for every $1 spent on
marketing, developers can earn $0.5 back the next day. This is coming from the APP’s structural
design of monetization, such as whether new users are shown ads, the timing of ad display, the
design of IAP scenes, and whether the App is first launched in the target region. Assuming that all
other conditions are the same, it can be concluded that the game in Campaign C has better
monetization design, which also shows that Campaign C can turn to profit the fastest, thus reducing
the financial pressure on developers and publishers. Especially for hyper casual games with
relatively shorter life time, ROAS can play a better guiding role.
How to obtain User level ROAS?
ROAS can well reflect a campaign’s marketing performance, the APP’s monetization and payment
collection ability. But ROAS only works best when it is substantiated at user level. With user-level
ROAS data, developers can acquire the most valuable users in campaigns, thus optimizing marketing
spending. Developers can also learn which users contribute the most revenue, making it easier to
adjust monetization strategy timely.
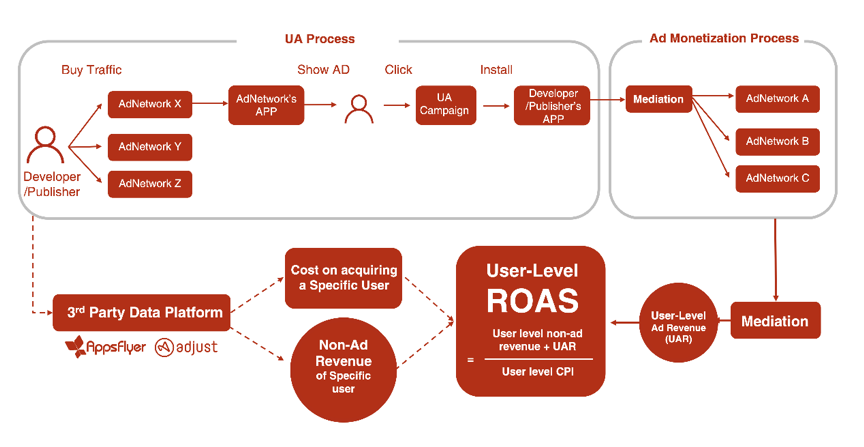
The difficulty in obtaining user-level ROAS is splitting user-level ad revenue (UAR). Marketing
spend and non-ad earnings are available through third-party monitoring platforms, however, ad
monetization data are from various Networks. Usually, an Ad Network only provides two dimensions of
the data through API, country and ad unit, but does not provide user-level insight. This has long
been a bottleneck in digital marketing.
The mediation SDK is a bridge connecting App with each Ad Network. Its ability to provide valid UAR
data is an important judgment of its mediation function.
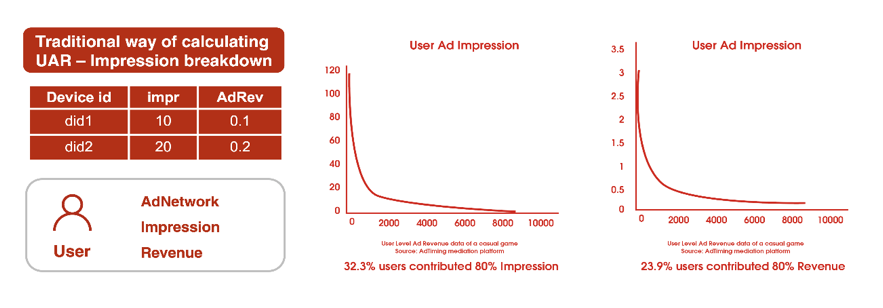
In order to get UAR data, the traditional approach is to estimate through simple display splitting.
For example, a user saw an ad 10 times on Device ID 1 and generated $0.1 revenue, then we can
predict if the user watches the same ad on Device ID 2 for 20 times, there’ll be $0.2 ad revenue
generated. This is only a basic algorithm. However, through the data on AdTiming Mediation platform,
it was found that 32.3% of users watch 80% of the ads, while 23.9% of users contribute 80% of total
ad revenue. In addition, the ad monetization revenue generated by the same user will gradually
decrease as the number of times of watching ads goes up. The eCPM of the first few ads served by Ad
Networks is the highest, so it is not reasonable to simply use ad display to calculate the UAR.
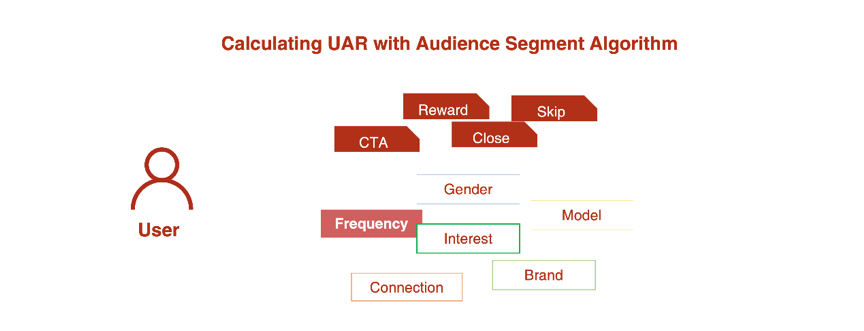
With our proprietary User Tags and Audience Segmentation, based on algorithm and intelligent models,
AdTiming is able to sketch each user's interest, gender, device model and other different dimensions
to form user image analysis. Combining with campaign tracking, and multi-aspect records from whether
the video ad has fully displayed or not, to user click, so as to obtain more accurate and reasonable
UAR data.
User-level ROAS improves monetization
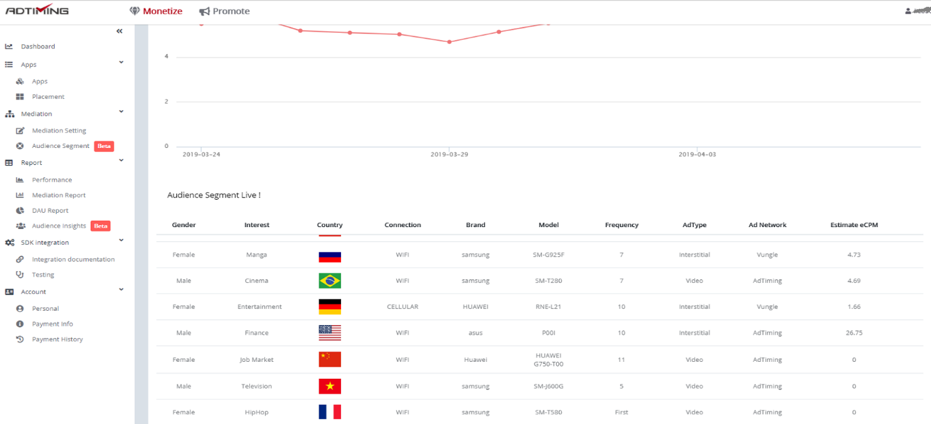
In order to allow developers better understand AdTiming's strength in user-level data analysis,
AdTiming visualizes some captured information in real time at developer’s end. The figure below
lists the data of gender, interest, country, connection, brand, model, Ad Network, frequency, ad
type, estimate eCPM and other dimensions. When this function was used to monetize ads, developers
saw an average 10% increase in revenue from image ads and about 20% increase from video ads.
User-level ROAS optimizes UA
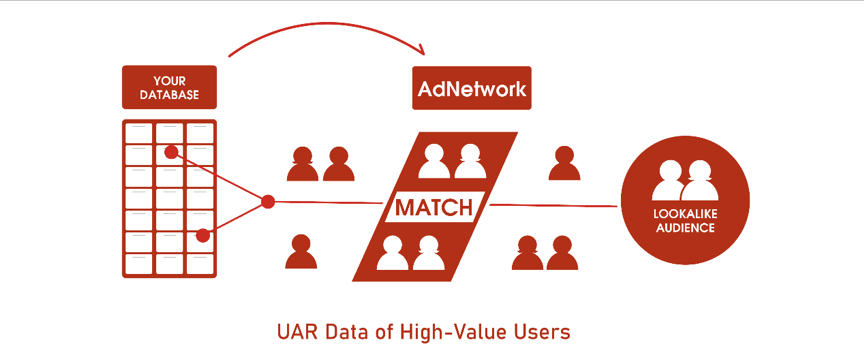
As mentioned earlier, 20% of the users contribute 80% of the revenue. When developers use AdTiming
Mediation to integrate data from both demand and supply sides, the UAR and user-level ROAS can be
obtained, so that valuable user groups can be defined and located at user level. After that, when
developers are campaigning for user acquisition, they can find out similar groups through Ad
Networks’ LOOKALIKE functions, thus the quality of new users is significantly improved and
unnecessary marketing cost reduced. With the powerful analytical capability of AdTiming Mediation,
developers are able to define high-value user groups to anchor the quality and efficiency of UA
while improving ad monetization revenue, thus forming a positive UA-monetization cycle, to
effectively improve App’s ROE.

 AdTiming